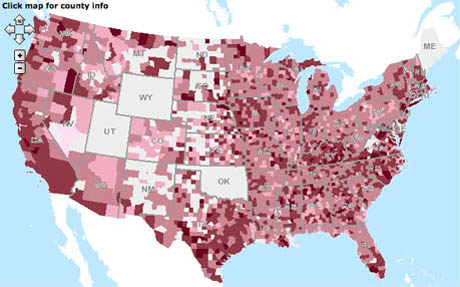
 In many ways we are actually what we eat and this article over at the blog for planetizen highlights some specific areas using GIS data that tell us a lot about ourselves as a country.
For thoes who don't know what Planetizen is, it is a:
public-interest information exchange provided by Urban Insight for the urban planning, design, and development community.
It has listings of jobs as well as books graduate schools and really lots of other very interesting and useful links and ideas for people in the planning field, especially people my age in undergraduate programs.
The blog entry I am highlighting was a quick mention of a new resource from the USDA, the Farm to school network, CDC, and the University of Illinois, Chicago(which has a good planning grad program actually) (among others). I was looking through the online Atlas, which gives an online visual representation to the data that was compiled by the group for this resource. It involves obesity percents by country, farmers markets, distance to food markets, restaurant expenditures, junk food taxes, percentage of fast food restaurants; big box stores and a whole lot more.
This data will be extremely interesting in raw form and put into a GIS database and manipulated to see more trends then the basic ones provided on the viewer. I was very excited to see this and I cant wait to have the time to take a look at the data and do some work normalizing data to population or land area to find some truly significant trends, as the article from ediblegeography (highlighted by planetizen) talks about looking at just diabetes rates, you can clearly see the significant proportion of the population in the south and south eastern US suffer from this health issue. Compare that to the %weight of fruits and vegetables eaten and you see that in this category the south does not consume as much as the west, east and west coast, is this a significant trend? I personally think so but you can look at the data and decide for yourself.
From planetizen via ediblegeography


 Posts
Posts